the squad
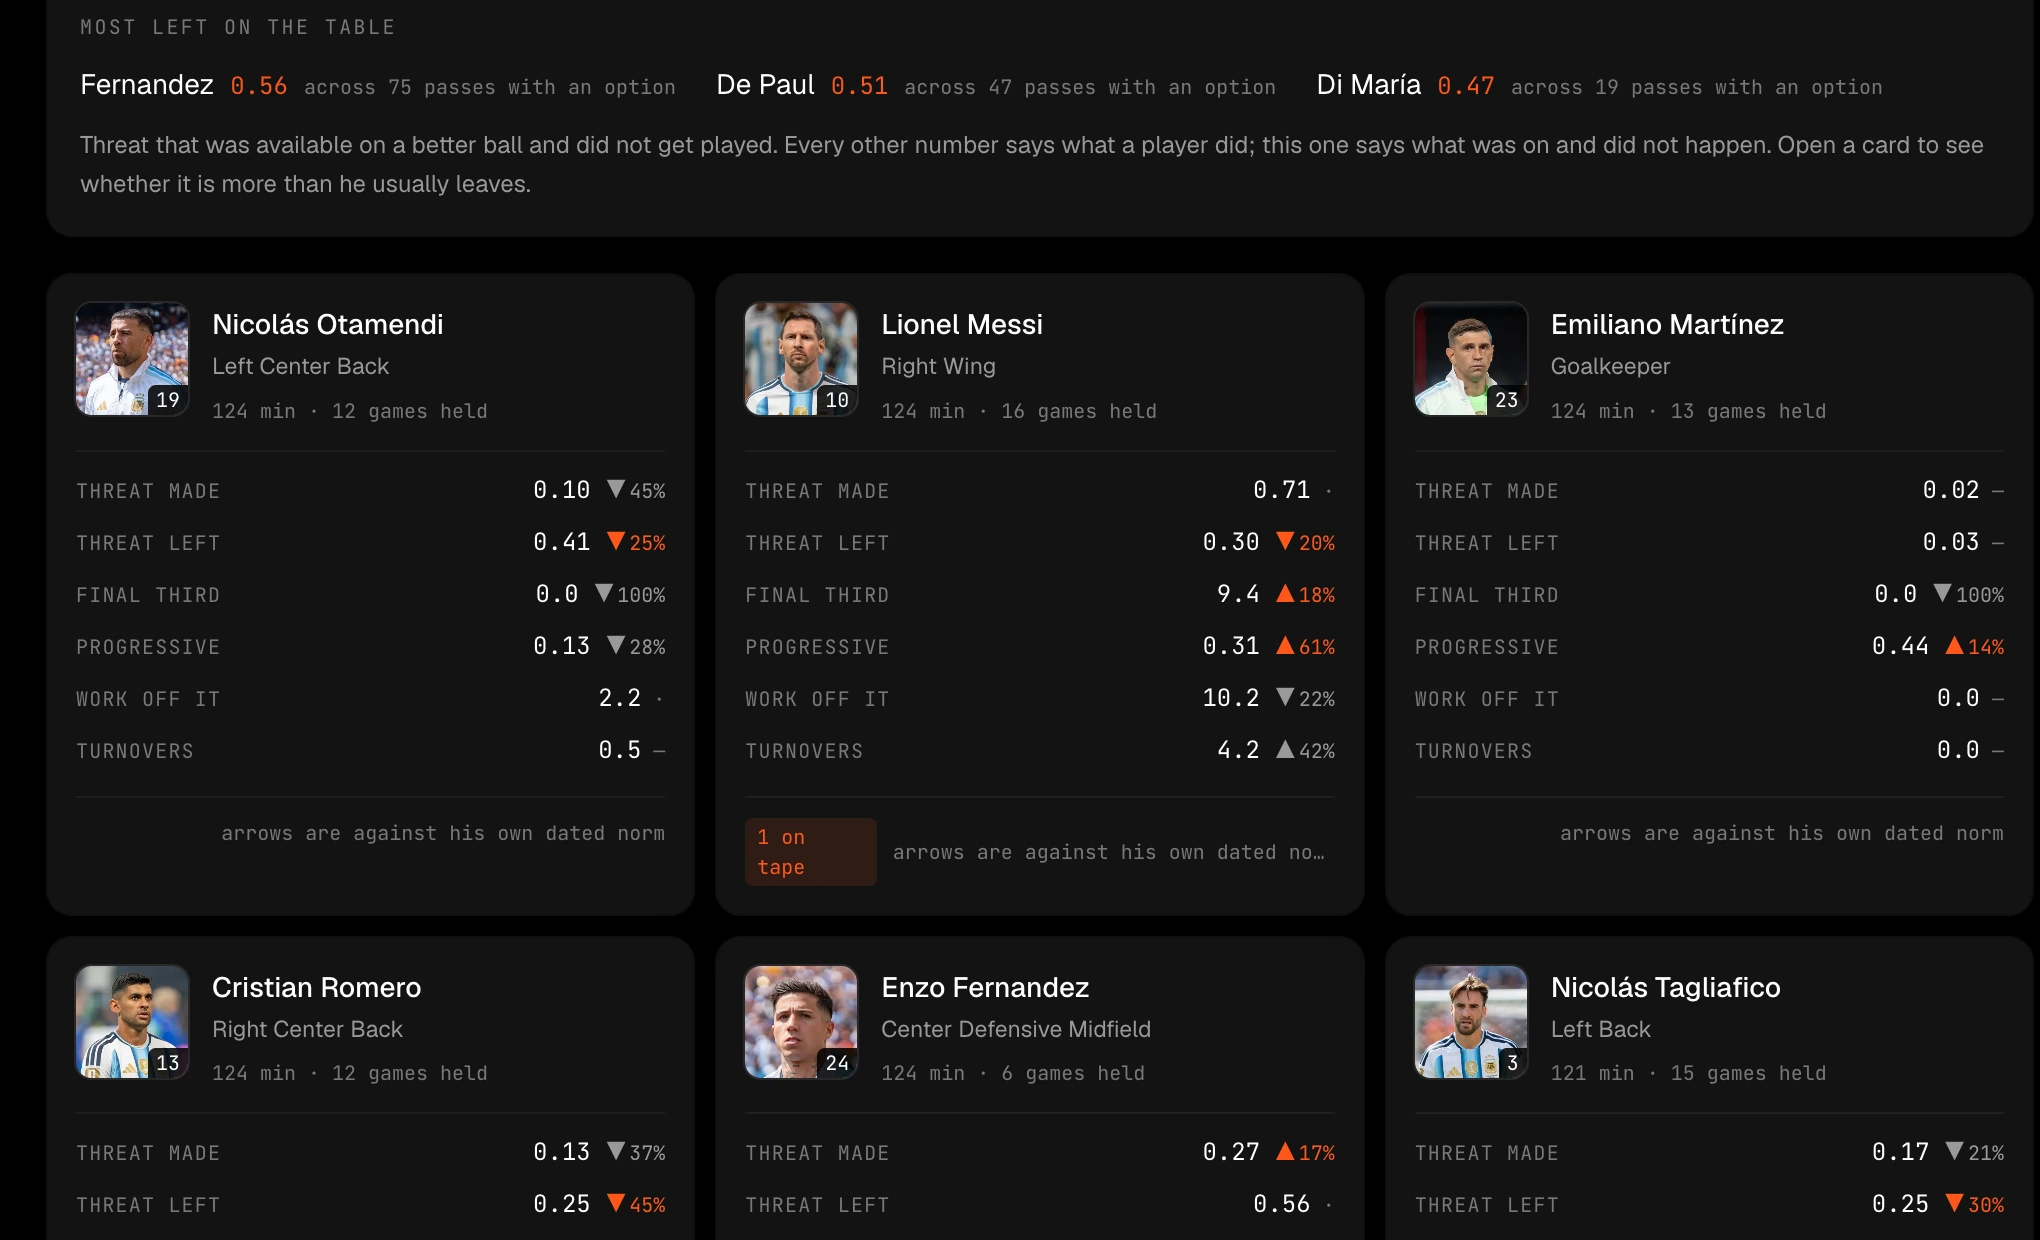
Every player, against his own norm
Not a league average. His threat created, his threat left on the table, and what that measure has been across every game the graph holds.
A vector store thinksBarcelona 2011 andBarcelona 2021 are the same team.
HydraDB doesn't.
Similarity finds the nearest neighbour. It cannot tell that a fact expired, so it averages the eras and describes neither.
Every fact here carries the dates it was true and a link to whatever replaced it. Ask about 2011 and about 2021 and you get two answers, both correct.
Not an upload form. Pep has been through the match, found the moments worth stopping on, and cut them from the broadcast. The video stays pinned and he works down the side of it, one moment at a time, the way a coach goes through tape with an assistant.
the squad
Not a league average. His threat created, his threat left on the table, and what that measure has been across every game the graph holds.
one player
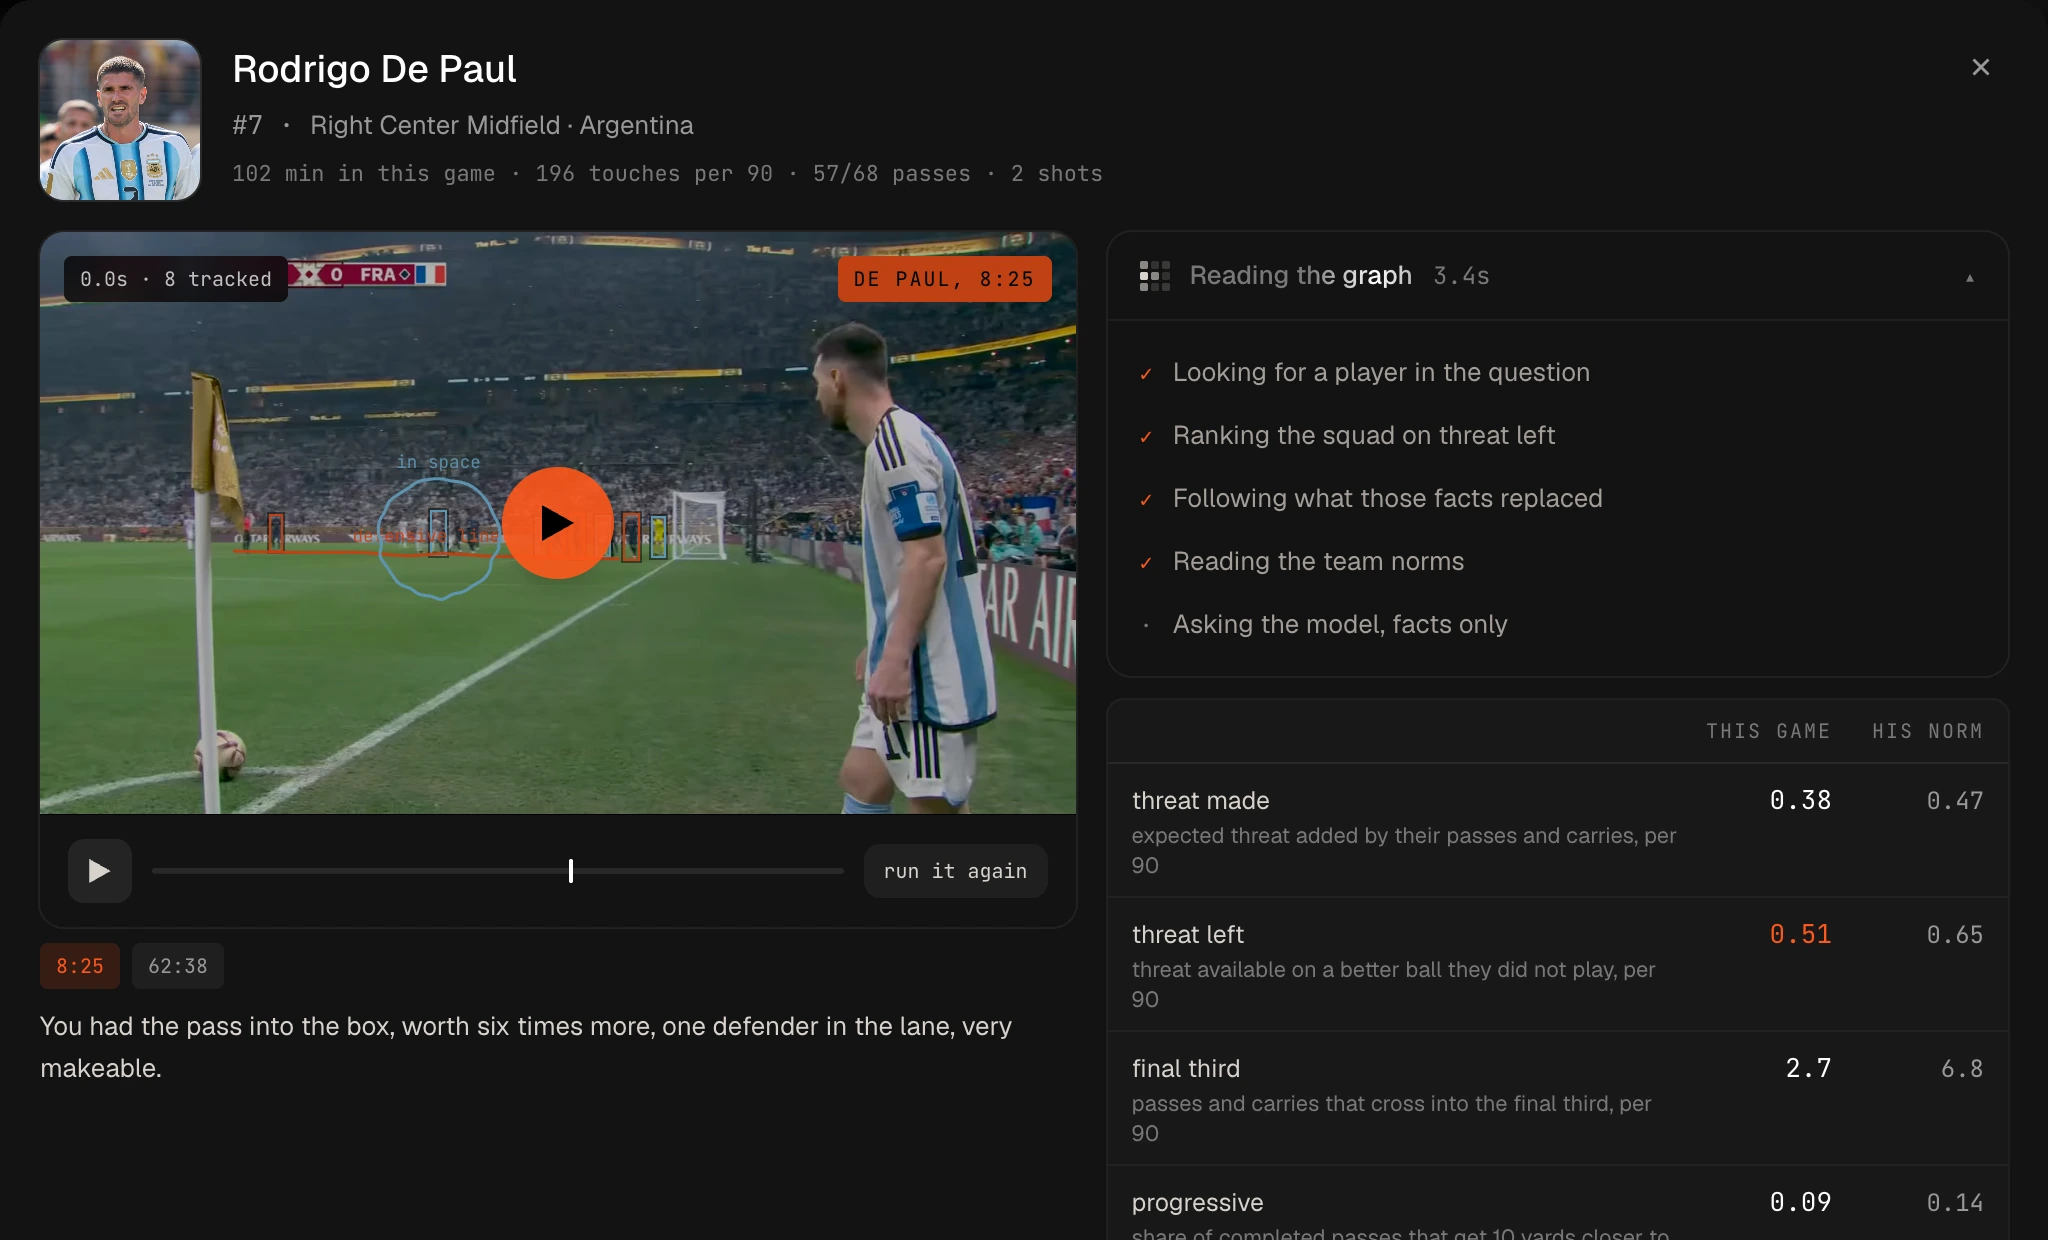
The ball he did not play, cut from the broadcast and tracked. Beside it, this game against his norm, and a line about what to work on.
The same question, the same model, the same match. With the graph connected he answers from 2,096 dated facts across 353 sides. Without it he can still read the game in front of him, and that is the point: what goes is not his eyesight, it is his memory.
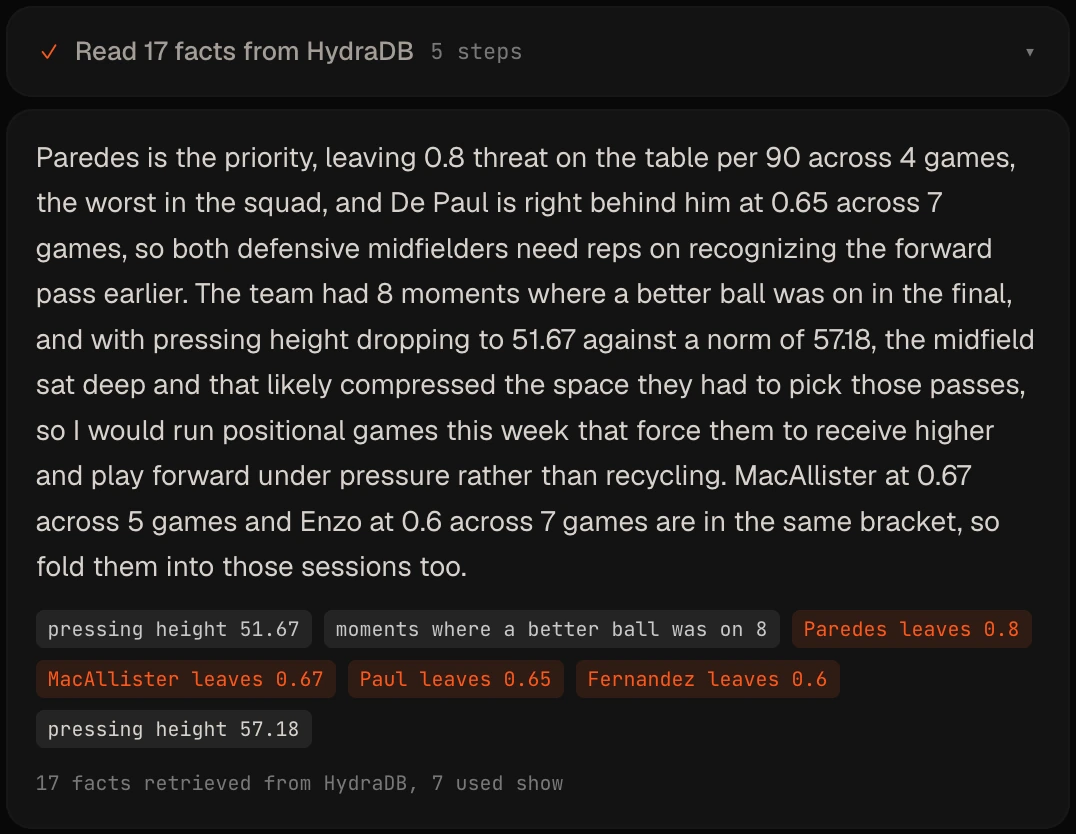
17 facts retrieved from HydraDB, 5 used
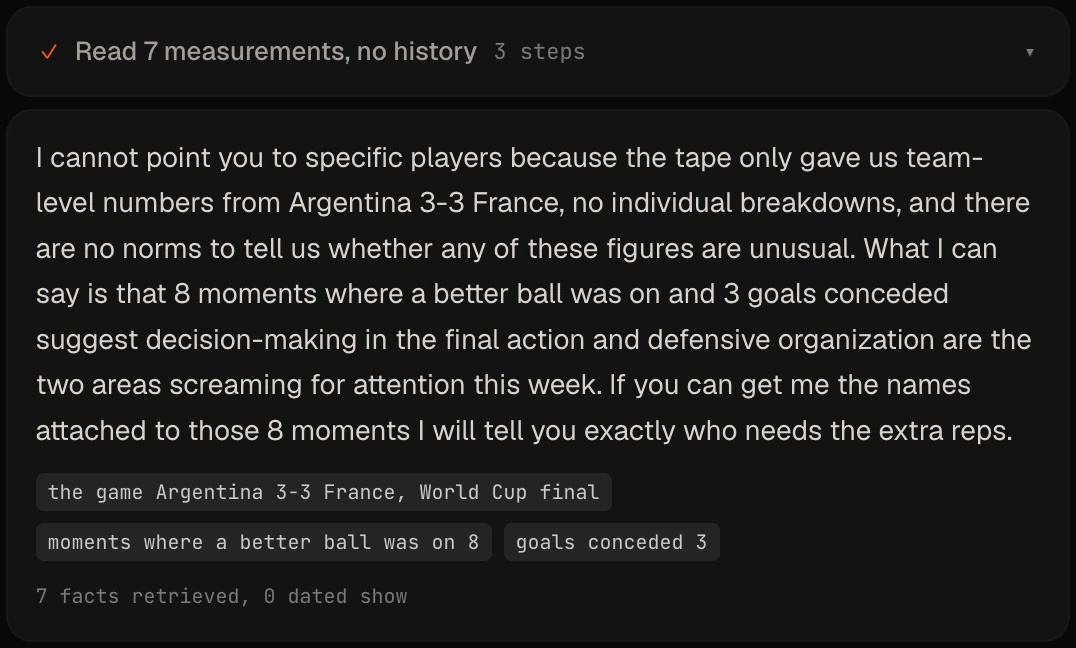
7 measurements retrieved, 0 dated
Neither answer is written anywhere. The switch is implemented in retrieval, which is the only honest place for it: with memory off the fact queries do not run, and everything measured off the match still reaches the model.
Eight minutes into the final, De Paul rolled it to the byline with a ball into the box on. Here is that instant as the video sees it, and as the graph sees it.
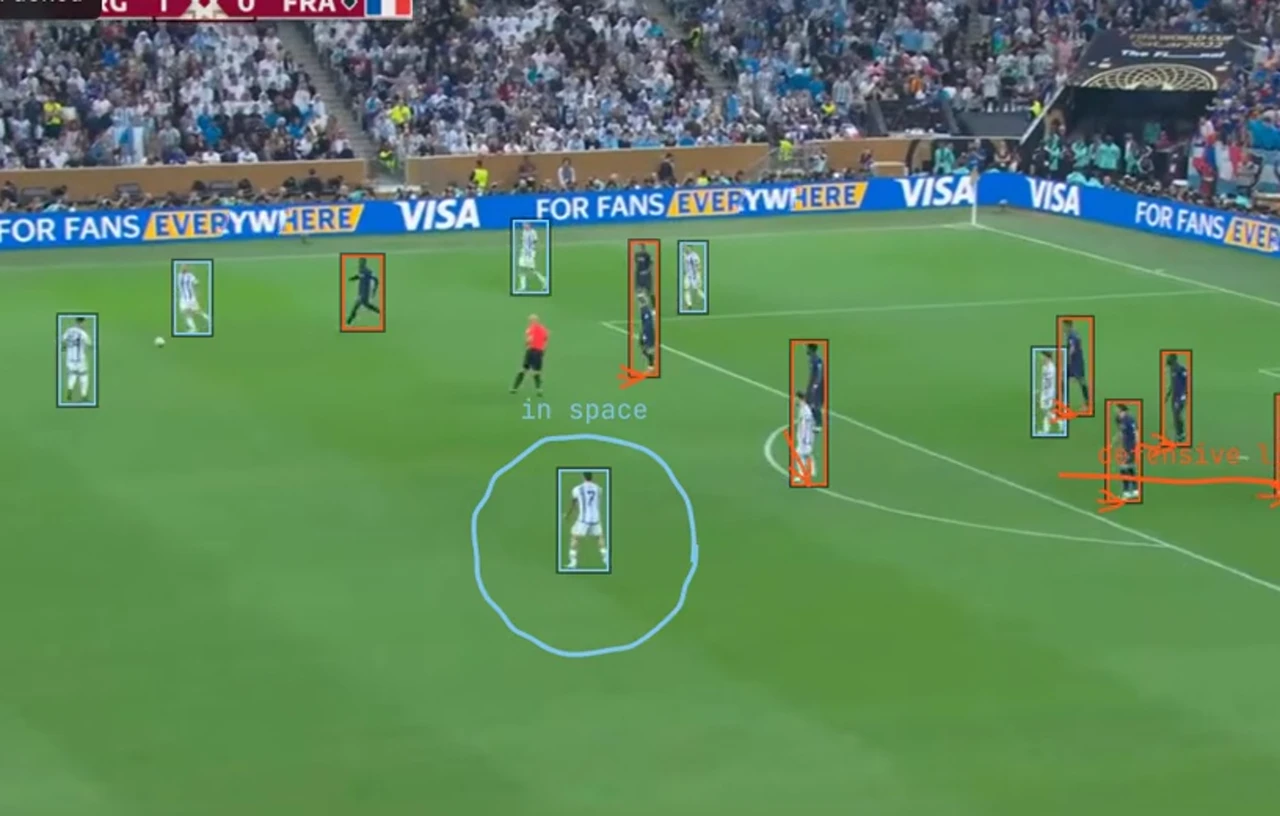
In pixels. YOLO11m finds the players. Kit colours are clustered frame by frame, because a stadium changes colour as the light goes.
In coordinates. The ball he played in chalk, the ball that was on in orange. Six times the threat, and no less likely to arrive.
Nothing joins those two pictures except the clock. A broadcast clock does not agree with a match clock, so one offset per period is read off the overlay, and that single measurement is what lets a number computed from event data point at a second of video.
Learned from elite football, then used to judge yours. Hover anywhere.
Then HydraDB decides whether it matters. One pass is an anecdote, so the moment is held against what this player and 352 other sides have done, every fact carrying the dates it was true and an edge to whatever replaced it.
Same build, same data, nothing staged. Point it at your own team by editing one file.